
Product Release + Tutorial: NDVI Time Series Analysis & Gif Animation
Tracking the Coffee Growing Season from Space

Remote sensing allows us to witness the pulse of agriculture from space. In this project, we’re going to use Google Earth Engine to trace a full coffee-growing season in southern Brazil by charting NDVI—an indicator of plant greenness (proxy for vegetation health)—month by month. This process not only reveals seasonal growth dynamics but also lays a foundation for replicable, scalable monitoring in other agricultural contexts.
The results will be:
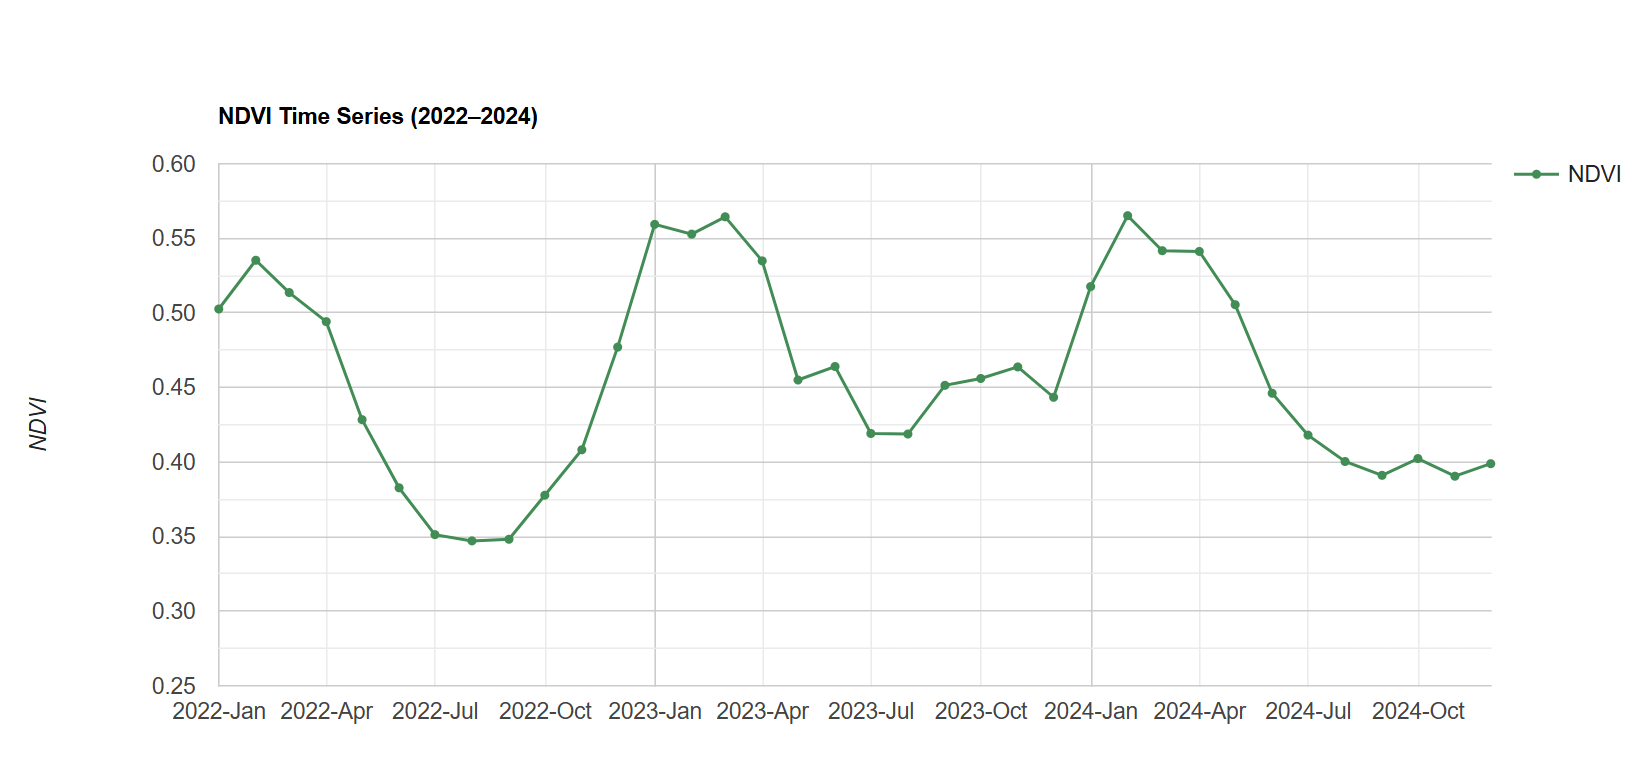
NDVI Time Series Chart
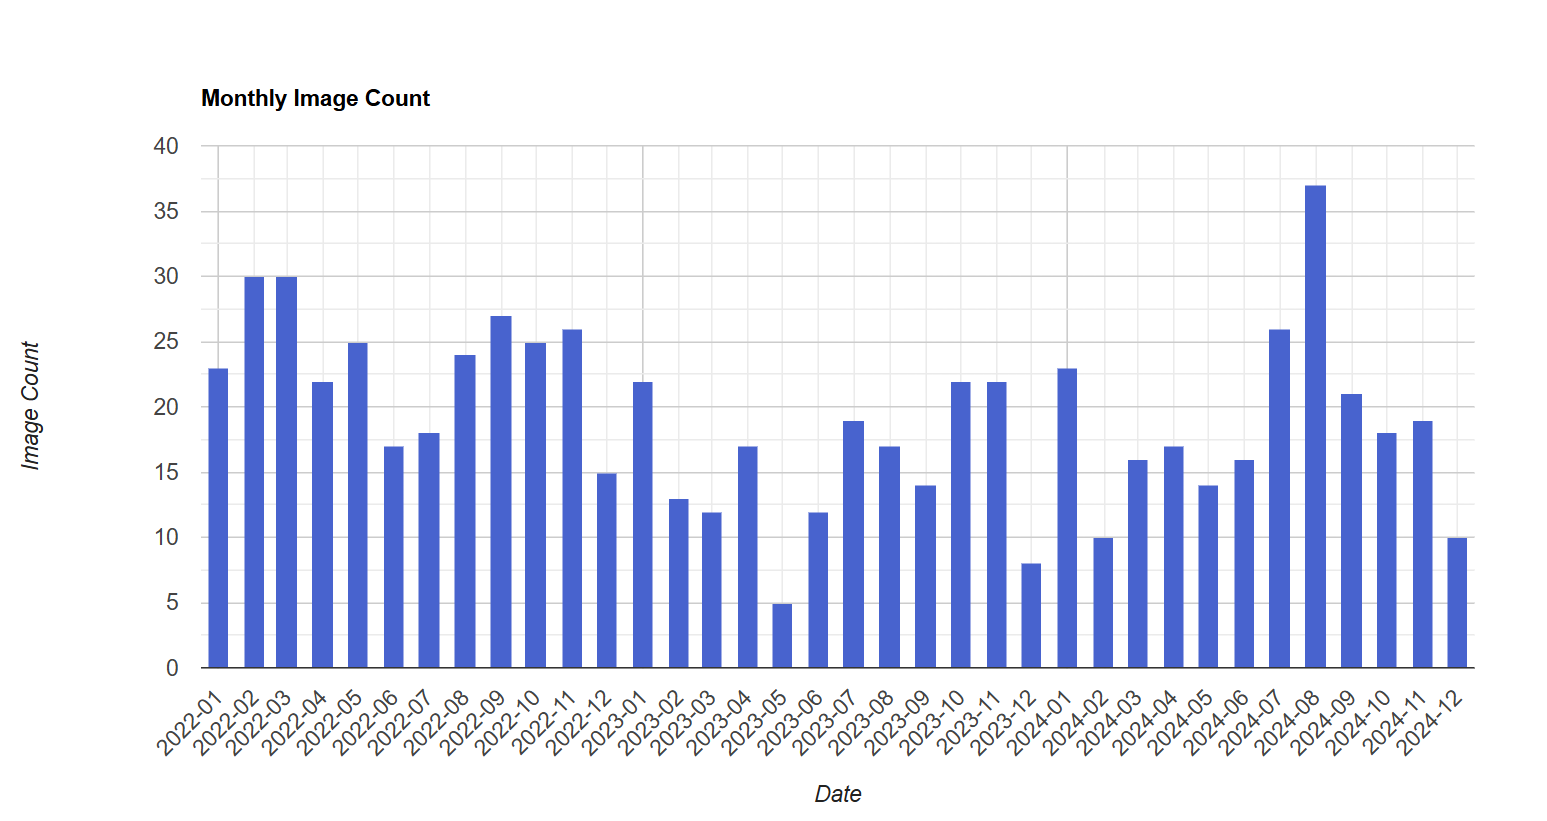
Monthly image count chart of Sentinel-2 images
Monthly NDVI gif animation
To access this code in Google Earth Engine, click here
The Source of Flavor team will be continuing to make these tools more accessible by providing a Google Colab notebook and open-sourcing the code on GitHub soon. So stay tuned for that.
NDVI from First Principles & Google Earth Engine
Here’s a link explaining what Normalized Difference Vegetation Index (NDVI) is and the underlying science as to how it’s derived. If you’re not familiar with remote sensing indices, I’d recommend giving this article a quick read before.
Google Earth Engine is a cloud-based platform that allows users to analyze satellite imagery and geospatial data at a planetary scale. Here’s a link to set up your GEE account to run this code.
🗺️ Step 1: Define the Scene
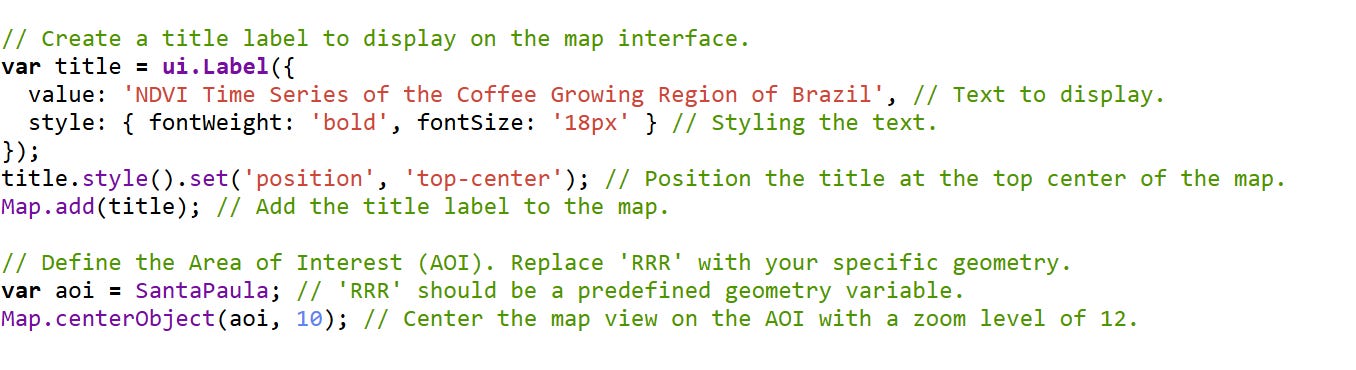
We begin by adding a map title using the Earth Engine UI API. It’s a small UX touch, but one that adds clarity, especially when exporting map frames or collaborating.
Next, we define the area of interest (AOI). In this case, SantaPaula is a geometry object representing the a region in Southern California where there’s a coffee farm (California Coffee Collective). We center the map to it.
☁️ Step 2: Mask the Clouds
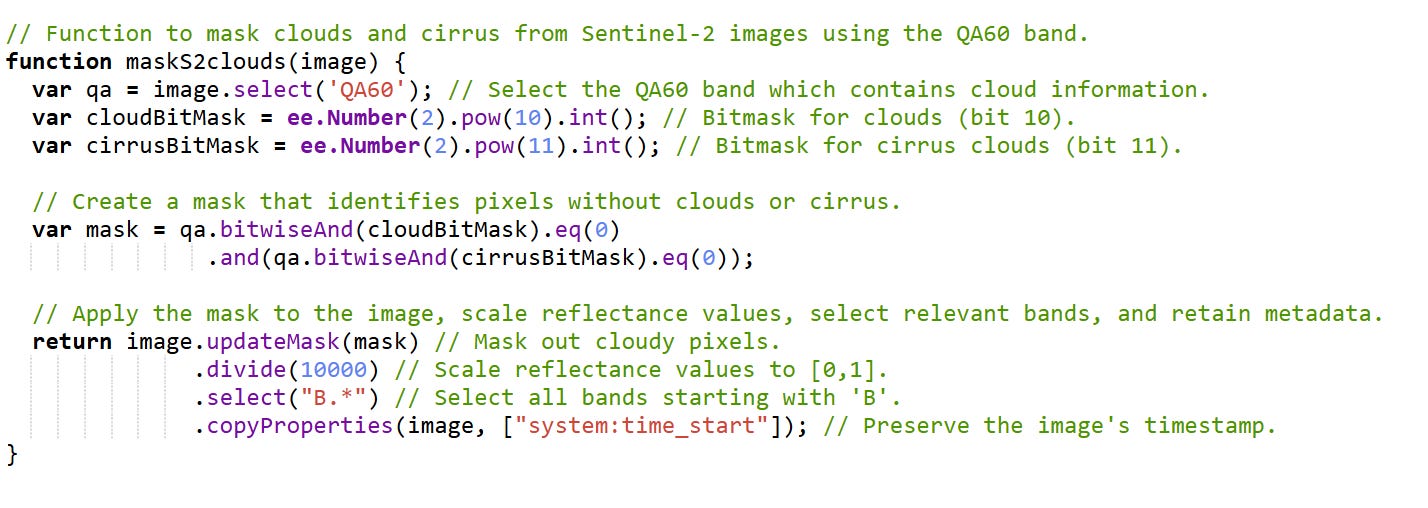
Why this matters:
Clouds obscure the surface and corrupt reflectance values. The QA60 band in Sentinel-2 marks cloud and cirrus contamination with specific bitmasks:
Bit 10: opaque cloud
Bit 11: cirrus
We use bitwise operations to remove these pixels.
Line-by-line:
qa.select('QA60'): accesses the quality band.bitwiseAnd(...).eq(0): keeps pixels that are not cloudy or cirrus-contaminated.updateMask(mask): applies this filter..divide(10000): Sentinel-2 data comes in integer format; we scale it to [0, 1]..select("B.*"): keeps spectral bands (e.g., B4 = red, B8 = near infrared).copyProperties(...): keeps the time metadata.
Result: A clean, radiometrically calibrated image ready for analysis.
📊 Step 3: Generate Monthly NDVI Composites
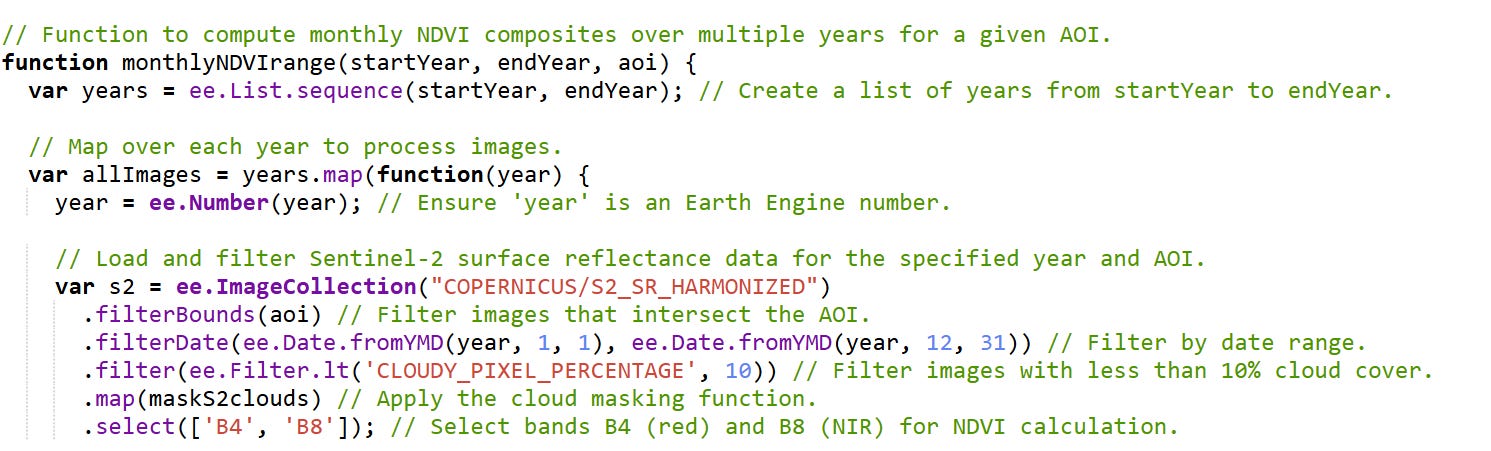
This core function generates NDVI composites for each month over a multi-year range.
Here’s what it does:
Filters Sentinel-2 data by location, date, and cloud percentage.
Applies our
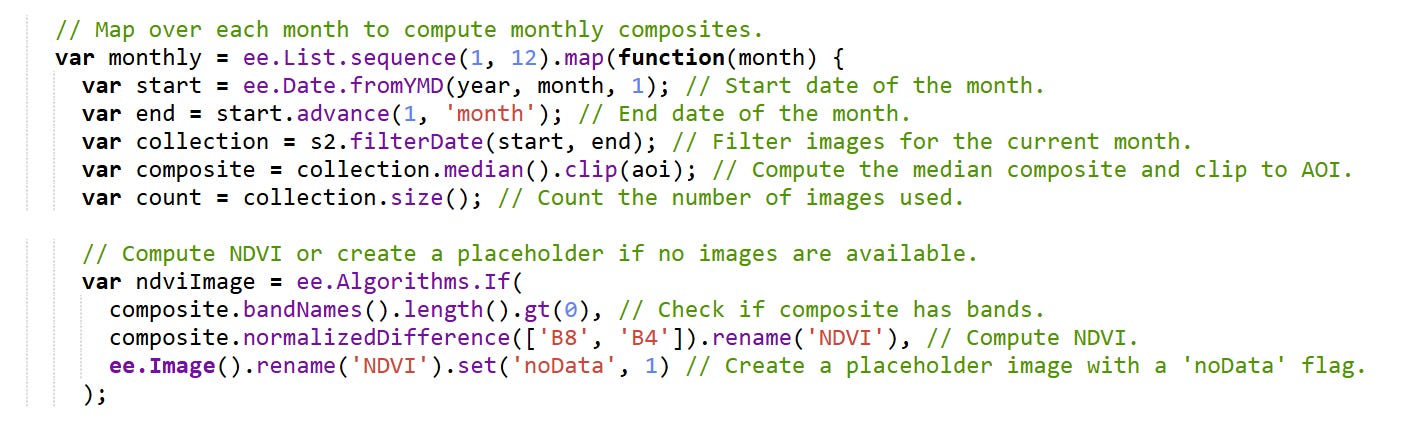
maskS2cloudsfunction.For each month, it:
Creates a median composite.
Calculates NDVI:
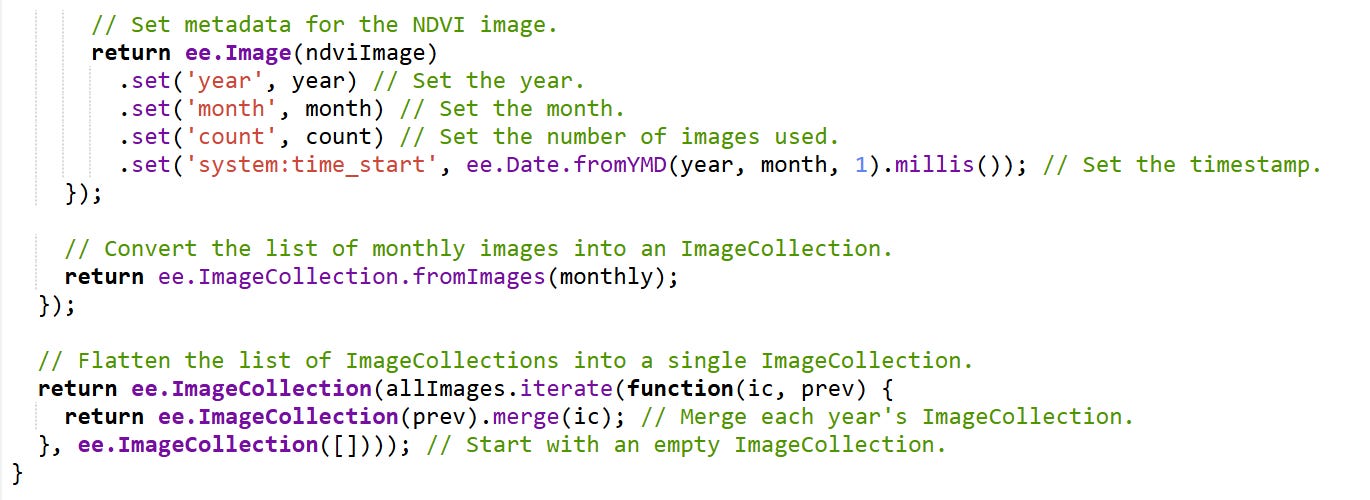
NDVI = (B8 - B4) / (B8 + B4).Adds metadata like year, month, image count, and timestamp.
Returns a single ImageCollection with NDVI layers sorted by time.
📤 Step 4: Export to Drive
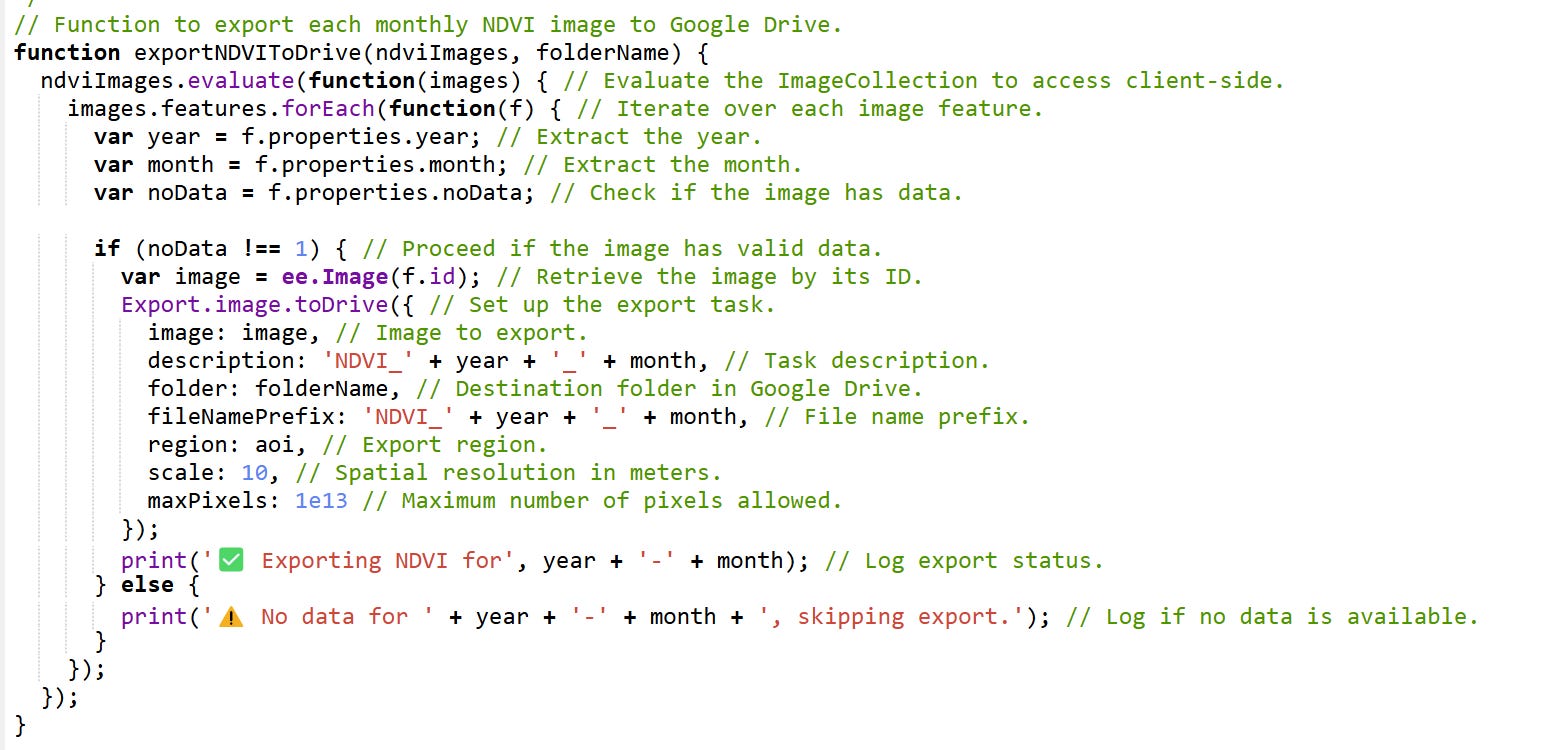
This function loops through each NDVI image and sets up exports for Google Drive. Only valid images (with data) are exported. This is critical for downstream analysis in Python or GIS tools.
🎞️ Step 5: Animate the Season
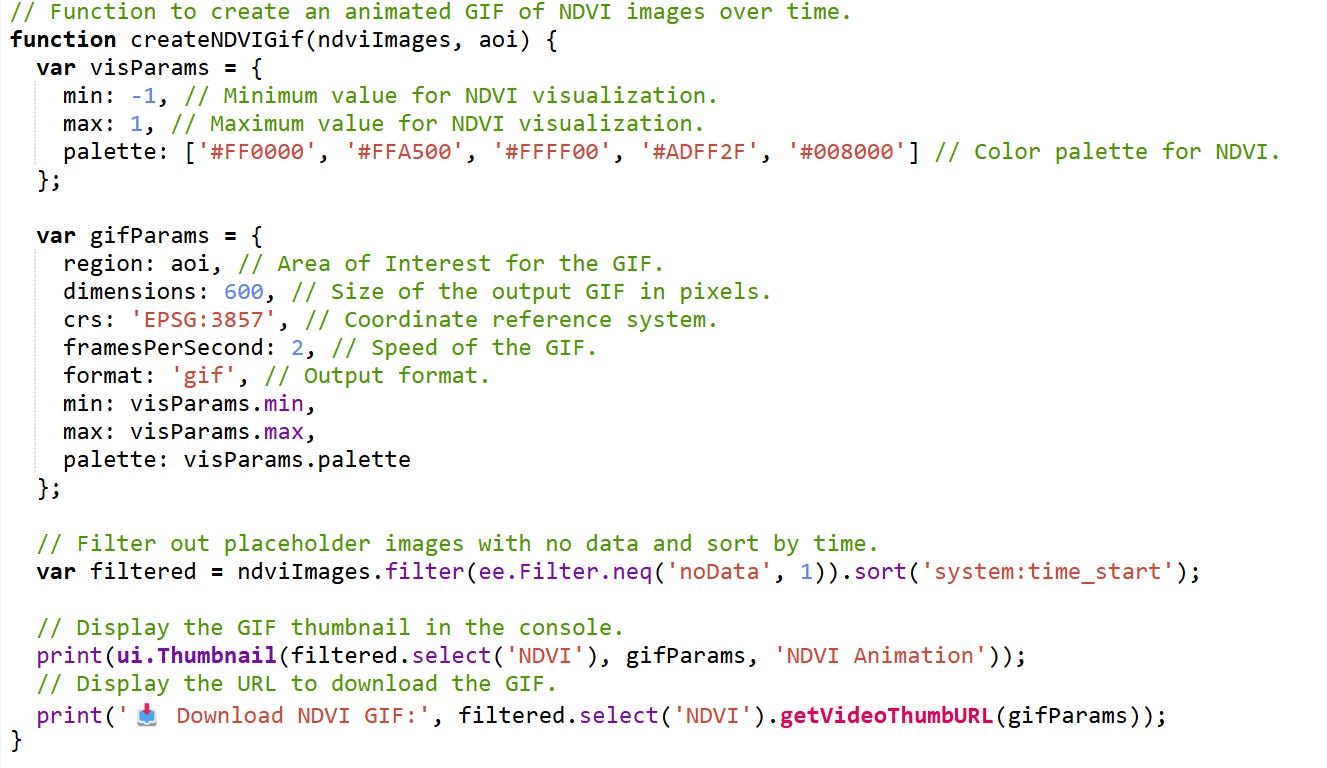
Animations make patterns pop. Using Earth Engine’s ui.Thumbnail, we generate a GIF that visually captures NDVI fluctuations over time. This helps stakeholders interpret crop health trends at a glance.
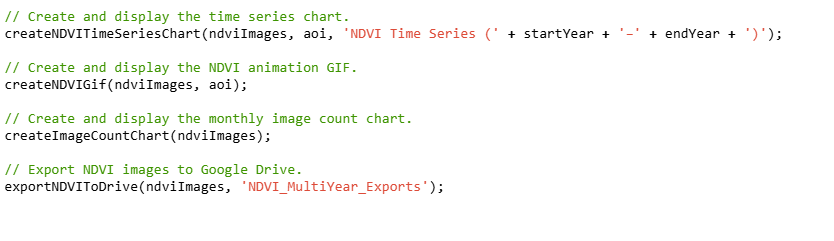
📈 Step 6: Visualize Trends
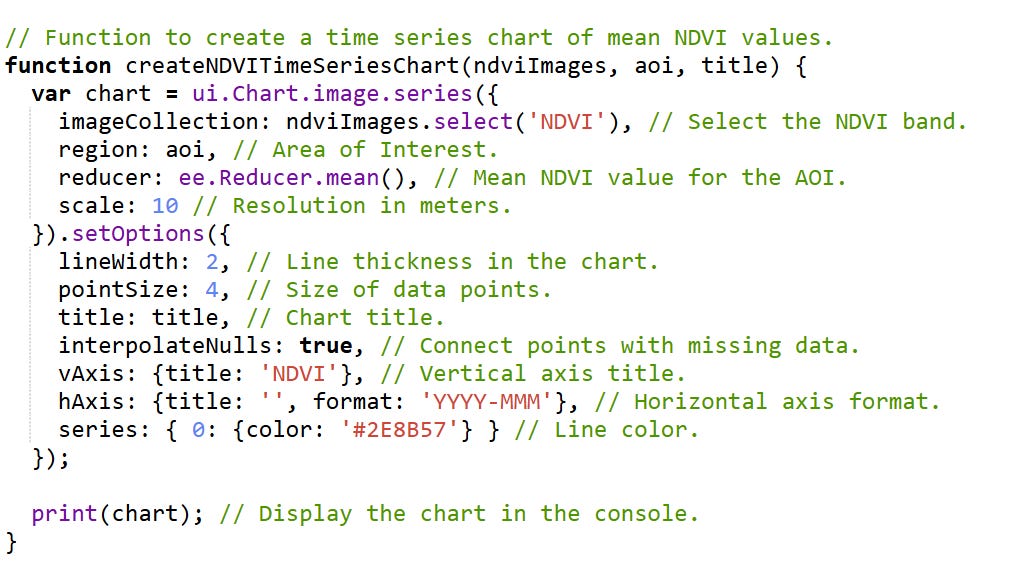
This chart plots monthly mean NDVI values. It’s your visual narrative: where the season peaked, when vegetation declined, and how robust the coffee canopy was overall.
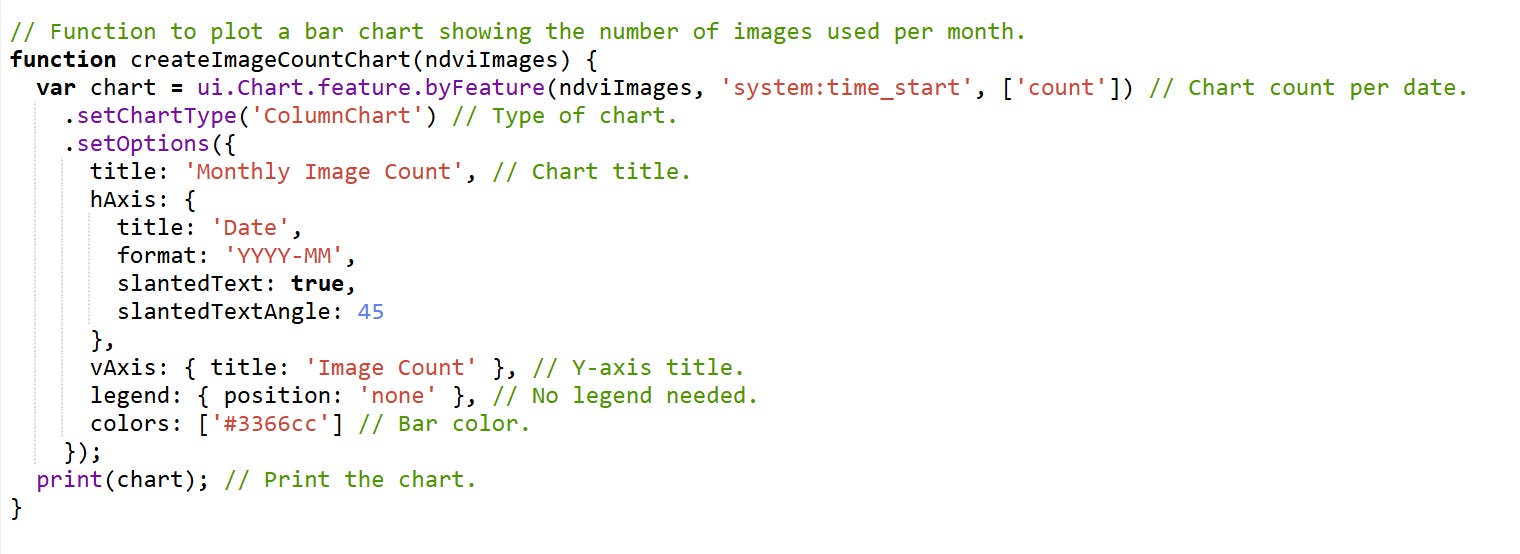
Image count charts reveal how much data was available each month, exposing any acquisition gaps or cloud interference.
🧪 Final Execution
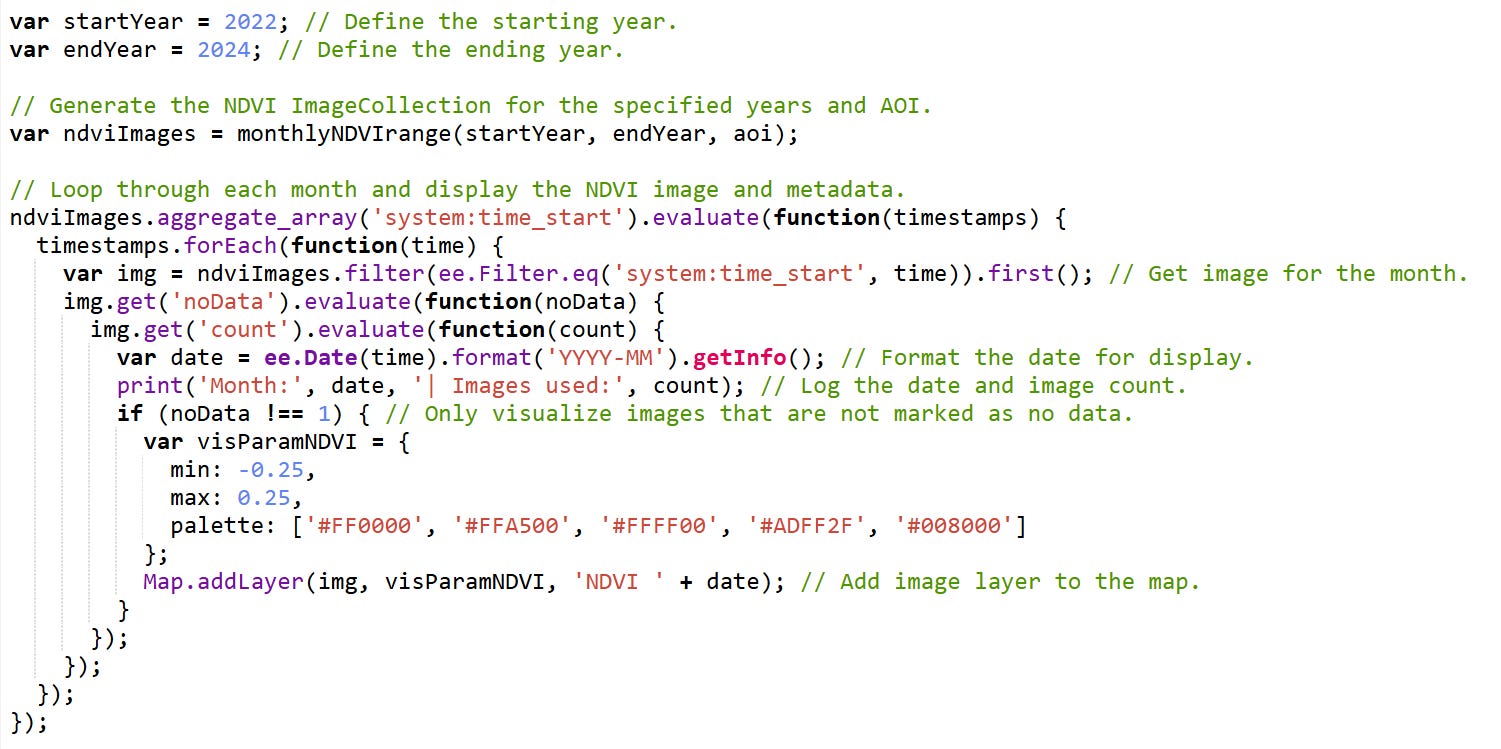
Execution plan:
Generate monthly NDVI composites.
Add each image to the map (if valid).
Display:
NDVI chart
Animation
Image count chart
Export images to Drive.
🌿 Why It Can Work for Coffee
Coffee’s canopy growth is highly seasonal and dependent on rainfall. NDVI tracks that growth, helping:
Monitor stress due to drought or pests.
Time harvest readiness.
Compare productivity between fields or years.